
30° to the side
Our exact example is marked at 8 kHz: −6 dB compared with the speaker’s own 0° response. Different frequencies spread differently; this is why off-axis tonal balance can change.
8 kHz difference-6 dB16 kHz difference-10 dB
LESSON 20 · SPEAKERS
Move away from the middle seat and the sound can change even though the volume knob hasn't moved. Speakers send different amounts of sound in different directions, and the difference can change with pitch.
One frequency, one angle, same measurement distance and signal. See exactly what this rating means ↓
DECODE THE EXACT STAT
In this example, 8 kHz sound is 6 dB lower at 30° sideways than directly in front.
Imagine measuring one speaker at the same distance in two directions while feeding it the same test signal. Straight in front is called 0°. Move the measurement microphone 30° sideways, and in this made-up example the 8 kHz sound pressure level drops by 6 dB.
A 6 dB drop in sound pressure level is about half the pressure amplitude. That's what the two bars show. It is not a claim that music suddenly sounds half as loud; perceived loudness is more complicated.
What this number cannot tell you: what happens at 1 kHz, whether the speaker is balanced on axis, how the vertical response behaves, how the room reflects sound, or how wide the best listening area is overall.
100% normalized pressure amplitude · our reference
About 50% of the reference pressure amplitude at 8 kHz
The bars show relative sound pressure at this one frequency, not perceived loudness, total music volume, full speaker frequency response or sound power.
The two bars plot the exact fictional rating. Normalized pressure = 10(level difference / 20), so 10−6/20 ≈ 0.501. No real speaker was measured.
SEE WHAT CHANGES WITH DIRECTION
Switch the angle. Each synthetic curve shows how much weaker that direction is than the speaker's own on-axis response at the same frequency. The scale always stays at 0 to −18 dB. The 30° curve includes the exact −6 dB at 8 kHz from the opening example.
Our exact example is marked at 8 kHz: −6 dB compared with the speaker’s own 0° response. Different frequencies spread differently; this is why off-axis tonal balance can change.
This graph compares every direction with the sound directly in front of the speaker, so its 0° line is always labelled 0 dB. That is the starting reference, not proof that the speaker plays every pitch equally loudly.
A small angle change causes a smaller loss of high-frequency energy in this fictional example. Real speakers can have resonances or directivity variations at different frequencies.
A much larger angle shows stronger high-frequency attenuation in this fictional example. This could influence side-wall reflections as well as listeners far off centre.
Original imaginary responses, not a manufacturer's measurement. The 0 dB reference at each frequency means “same as on axis there.” It does not mean the speaker's on-axis frequency response is perfectly flat.
Compare the two pairs in the same positions, at the same distance and with their on-axis levels aligned. The solid lines show what reaches you straight ahead. The dashed lines show the direct sound if you turn each speaker so your seat is 30° from its axis.
Start with the voice and cymbals. Follow one trace from left to right to see tonal balance. At any one frequency, the vertical gap between a speaker’s solid and dashed lines shows what changes with angle. To compare the two models, first align their on-axis levels at a reference frequency. The examples below use 1 kHz and apply the same level adjustment to both traces for each speaker.
Facing the speakers: Around 5 kHz the LS50 has roughly 3 dB more output relative to its 1 kHz level than the 8030A. That can make consonants and the initial edge of a cymbal hit stand out more on the KEF when the recording has energy there. A more prominent edge can sound like extra detail. The graph shows a difference in emphasis.
At 30°: The LS50 loses about 4 dB around 5 kHz compared with its own straight-ahead response. The 8030A loses about 1 dB there. After the 1 kHz alignment, the two speakers are close to the same level at 5 kHz at this angle. At 10 kHz the situation changes. The KEF’s traces nearly meet, while the Genelec’s off-axis trace is about 2 dB below its on-axis trace. At 30° the KEF is roughly 2 dB ahead there after alignment. So a listener may hear the KEF’s consonant edge soften as the speakers turn away, while a little more of the upper-treble shimmer remains audible compared with the Genelec. The next section uses a fixed room and seat to compare what comes back from the sidewalls.
KEF lists the original LS50 at 79 Hz–28 kHz (±3 dB) in its manufacturer brochure. The tolerance describes a 6 dB-high window around the spec’s reference level over the stated range. The independent plot here spans 500 Hz–20 kHz, so the brochure supplies the wider frequency limits. The vertical gap at 5 kHz compares two angles at one frequency.
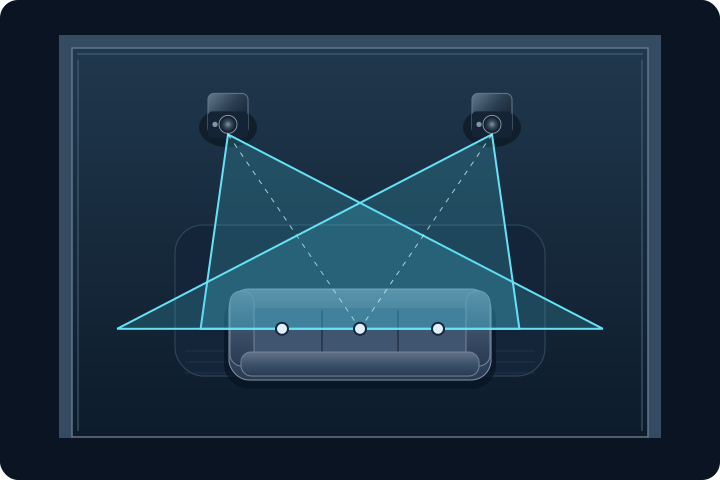
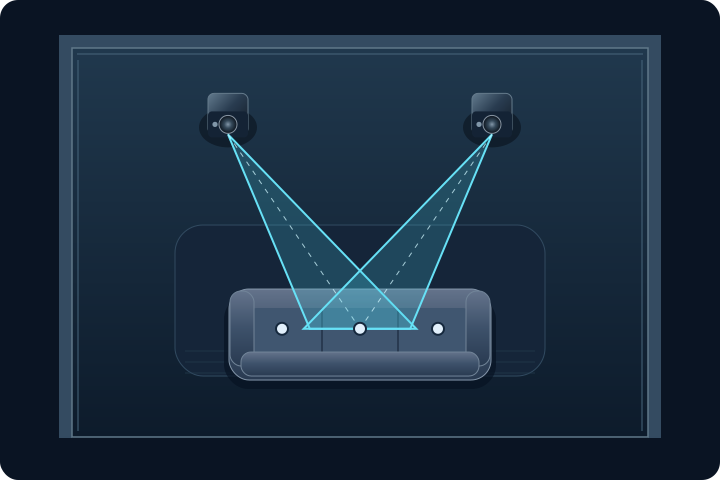
Keep the same seat and swap the two pairs into the same spots. The speakers are 6 ft apart and 2 ft from the front wall, aimed at a seat centered 9.71 ft behind the speaker line. Both sidewalls are painted drywall. The direct sound comes from the 0° axis. The first bounce leaves each speaker at 60°, so this example uses the 60° traces from Princeton’s original charts for the KEF and Genelec.
A centered voice around 4 kHz. With the same 1 kHz alignment, the KEF’s direct sound is about 2–3 dB stronger here, while the Genelec’s first sidewall bounce is about 2 dB stronger. The KEF may give the edges of consonants more bite straight ahead. The Genelec sends more of that part of the voice back from the sides, so the consonants could feel a little less tightly gathered around the center.
Cymbal shimmer around 10 kHz. The direct levels are close, and the KEF’s first bounce is only about 1 dB stronger in this layout. Expect a smaller difference here than in the vocal example. With the left and right paths symmetric, a centered vocal can stay centered on both pairs even if its edges feel a little wider on one.
The comparison models one first bounce per speaker. We assume 3 dB of loss at each wall as an illustrative value, plus about 2.3 dB from the longer path. Around 4 kHz, that puts each first bounce approximately 17 dB below the KEF’s direct sound and 12 dB below the Genelec’s. These are separate path levels estimated from digitized measurements. The example leaves out phase summation and other reflections, so the listening impressions are hypotheses for this layout.
A formal off-axis test can measure many angles in both horizontal and vertical planes. ANSI/CTA-2034, commonly called a spinorama, groups these measurements into summaries. On-axis is one reference direction. The listening window is an average of nearby response directions, including angles out to ±30° horizontally and ±10° vertically. Early reflections estimates first-bounce reflected energy using a defined angle-weighted procedure. Sound power estimates radiated acoustic output averaged over directions.
Directivity index compares the level of a forward/listening-window response with a wider-angle response. Its trend can tell you how radiation becomes more focused with frequency. A smooth trend is often more informative than a single advertised “dispersion angle.” These are standardized measurement summaries, not a guarantee of a particular room's exact response.
Read more about soundstage, imaging and separation in the glossary.
ANOTHER DIRECTION TO THINK ABOUT
A published horizontal plot tells you what happens when you move left or right. A vertical plot describes moving above or below the speaker's reference axis, such as standing up from the sofa or sitting lower than the tweeter.
A speaker often has a woofer for lower notes and a tweeter for higher ones. Around the notes where both contribute, their sound can add together or partly cancel depending on whether your ears are higher or lower. Engineers call this pattern vertical lobing. It helps explain why standing up can change the tone even if you stay the same distance away.
A speaker may have smooth horizontal coverage across your couch while exhibiting a narrow vertical sweet spot near the crossover. Another design may behave differently. A horizontal “±30°” figure says nothing reliable about its vertical coverage.
When reviewing speaker measurements, look for both directions, especially if your speakers sit high, low, on a shelf, or cover people at different seated and standing heights.
For a named frequency and measurement plane, a −6 dB coverage or beamwidth can mean the angular width between directions where sound pressure has dropped 6 dB relative to the relevant reference or maximum. Check whether the published value means full included beamwidth, or an angle from the centre line, and whether it refers to horizontal or vertical coverage. The example here specifies one offset angle: 30° horizontally. It does not assert that the full beamwidth is 30° or 60°.
Integrity note: The angle selector and smooth-versus-uneven examples use illustrative curves. The LS50 and 8030A overlay is digitized from published anechoic measurements.